Analysis Objectives
The textual analysis pursued the following goals:
- Enrich the dataset with missing information (e.g., gender and brand);
- Analyze the relationship between textual content and likelihood of sale;
- Identify patterns and textual signals predictive of commercial success;
- Evaluate the quality and structure of user-generated texts.
Methodology
Cleaning and Pre-processing
A classic text preprocessing pipeline was implemented:
- Lowercasing;
- Stopword removal;
- Symbol and emoji removal (preceded by occurrence analysis);
NLP Techniques
- Regex for cleaning, pattern matching, and initial information extraction;
- TF-IDF for exploratory analysis and initial vector representation;
- Word2Vec and Sentence2Vec for semantic embedding;
- LLM (GPT-3.5) for experiments in extracting concepts and topics.
Overall, the results were fairly limited due to the low coherence and quality of the available textual data, which would require more extensive preprocessing or domain-specific models.
Dataset Enrichment
Through text analysis, it was possible to:
- Assign a gender to items (M/F/N), with “N” used for ambiguous cases;
- Recover information on brands, product categories, and styles when missing from the metadata.
This made it possible to observe that items with gender F show a higher likelihood of being sold.
Quantitative Analysis
Text Length
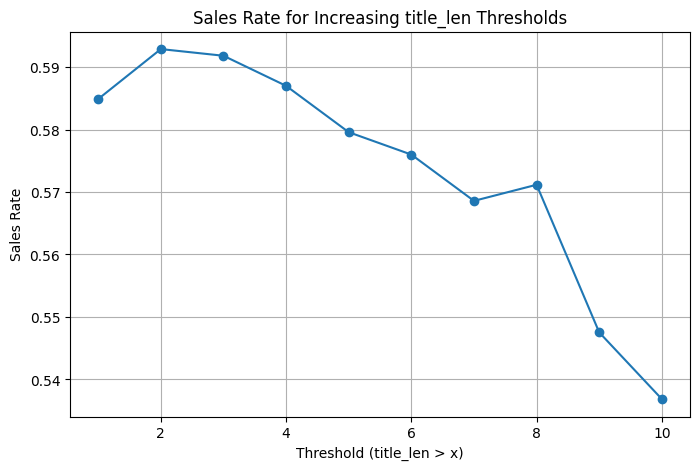
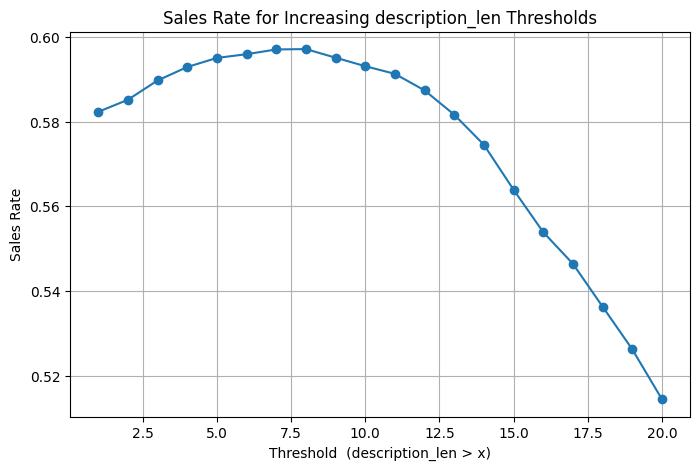
A significant relationship emerged between text length and the likelihood of sale:
| Text Type | Ideal Length (in number of words) |
|---|---|
| Title | 2–6 words |
| Description | 4–12 words |
Texts that are too short or too long tend to correlate with lower sale rates.
Semantic Analysis
Key Expressions: “mai…” (“never…”)
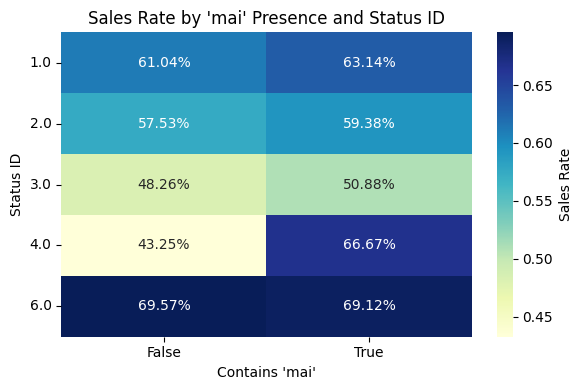
Phrases starting with “mai…” (e.g., mai indossato, mai usato — “never worn”, “never used”) appear frequently and have a positive impact on sale rates.
The only exception: for items already classified as “new with tag”, the effect is neutral; instead, the effect is particularly positive for items classified as “satisfactory”, suggesting a persuasive power in this phrasing.
Token-Level Impact on Sales
To identify which textual elements most influence the likelihood of an item being sold, a token-level analysis was conducted using the log-odds ratio between sold and unsold items. The process involved the following steps:
- Preprocessing: Titles and descriptions were normalized through lowercasing, accent removal, punctuation stripping, and whitespace cleanup.
- Tokenization: Using Scikit-learn’s
CountVectorizer, unigrams and bigrams were extracted with a custom regex pattern (3–18 letters) and filtered through an extended list of Italian stopwords. - Frequency filtering: Only tokens appearing at least 100 times in total and 20 times in both sold and unsold subsets were retained to ensure statistical reliability.
- Log-odds calculation: For each token, the log-odds ratio was computed with additive smoothing (α = 0.5) to measure its association with the “sold” or “unsold” class.
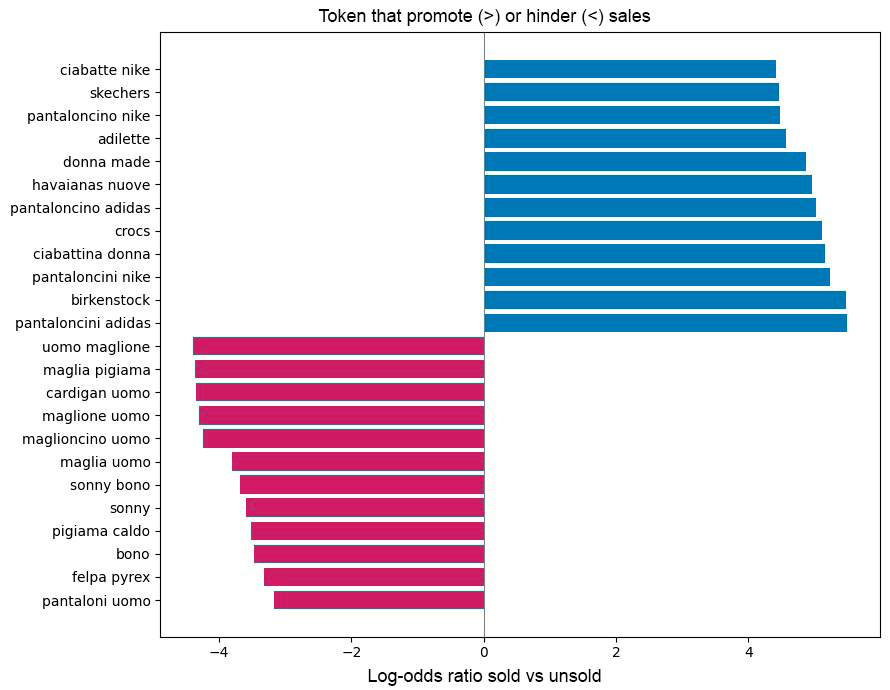
Tokens with the highest positive log-odds were strongly associated with sold items, while those with strongly negative log-odds were more common in unsold listings.
The following chart illustrates the 12 most “positive” and 12 most “negative” tokens in terms of their impact on sales:
Semantic Map of Listings
To explore the semantic structure of user-generated content, a dedicated embedding pipeline was applied:
- Texts (
titleanddescription) were first cleaned and normalized, removing symbols, punctuation, and inconsistencies; - Each text pair was embedded using the
paraphrase-multilingual-MiniLM-L12-v2model, producing 384-dimensional sentence vectors; - The high-dimensional embeddings were reduced to 2D using UMAP (Uniform Manifold Approximation and Projection);
- The result is a semantic map that visually represents listings based on textual similarity.
The map shows some small emerging semantic clusters, especially related to product type, condition, or style, although the separation is not always sharp due to the heterogeneity of the texts.
An interactive version of this map was built using Altair, allowing the user to explore the dataset by brand or sale status, with the ability to highlight items and inspect details through tooltips.
The chart is based on a random sample of 5,000 observations (out of ~400,000) to ensure optimal rendering and interactive performance.
Text Clustering with HDBSCAN
An initial attempt to identify latent structures in the product-related textual data was made using KMeans clustering, applied to text embeddings. However, this approach yielded limited results, as KMeans assumes spherical clusters of similar size and density—conditions rarely met in real-world, user-generated content.
As a result, we shifted to HDBSCAN, a clustering algorithm more suitable for noisy datasets and for identifying clusters with irregular shapes and variable density—which aligns well with the nature of user-generated content, typically noisy, unstructured, and semantically overlapping.
The original embeddings were reduced to 50 dimensions using UMAP, a non-linear dimensionality reduction technique well-suited to preserving the local and global structure of textual embeddings.
After several experiments, the following parameter configuration was selected:
min_cluster_size = 2000min_samples = 15
These values were chosen to generate larger, more stable, and semantically interpretable clusters, while avoiding excessive fragmentation.
The final clustering outcome included 39 distinct clusters, along with approximately 120,000 points identified as noise (cluster = -1). Given the noisy nature of the initial dataset, this level of segmentation is both acceptable and aligned with expectations for user-generated data.
This result represents a significant step forward in semantic clustering. Several well-defined clusters emerged, often aligned with specific brands or product types. Notable examples include:
- Cluster 1: summer footwear from the brand Havaianas
- Cluster 2: bikinis and women’s swimwear
- Cluster 3: sportswear from Adidas
- Cluster 5: items made of denim
- Cluster 20: men’s swimwear
- Cluster 38: clothing for children
These findings suggest that HDBSCAN-based clustering, if further refined, could become a powerful tool for data enrichment, enabling the assignment of inferred attributes such as category, subcategory, or style to items that lack complete metadata.
Explorative Predictive Models
Several models were tested to predict the likelihood of sale by combining structured and textual features:
- Random Forest
- XGBoost
- LightGBM
- Neural Networks
Text-derived features (e.g., embeddings, length, key expressions) proved to be useful and complementary to classical variables.
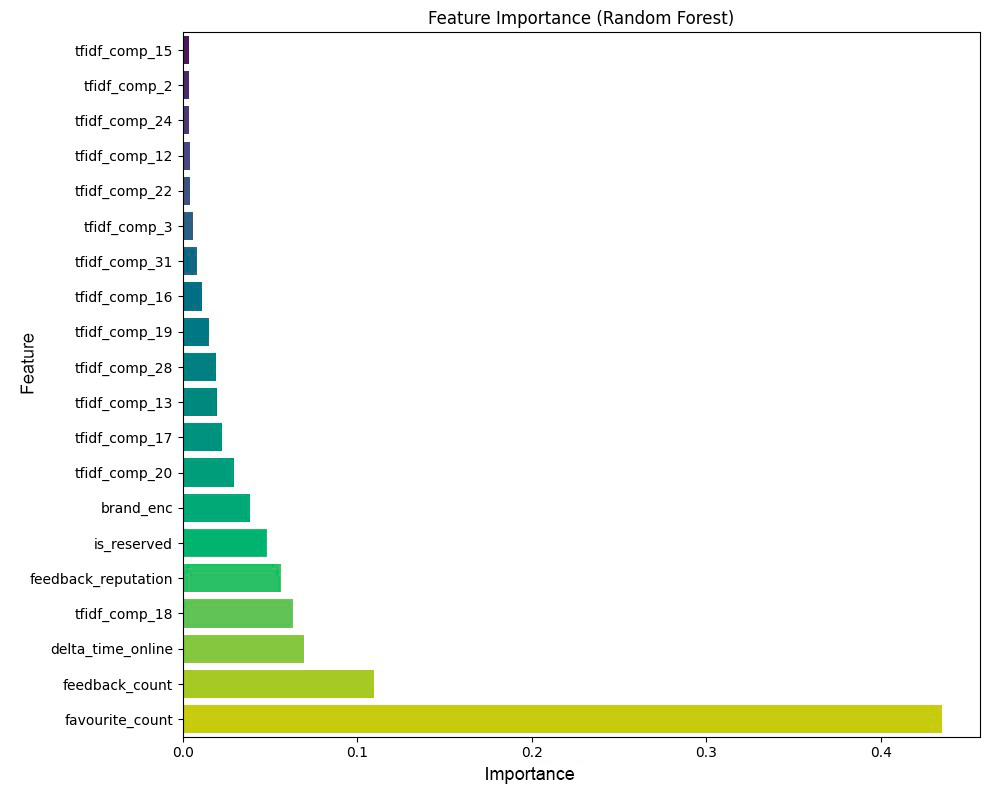
Feature Importance Insights from Random Forest
In an exploratory application of a random forest model, analysis of feature importance revealed that the textual embeddings derived from TF-IDF do indeed carry significant weight. Notably, component 18 emerged as particularly influential in this example.
A deeper investigation into this component showed that it predominantly represents listings for men’s clothing in good condition—often described as new or barely worn—and includes details related to color and garment condition. While there are other components with a strong presence of men’s items (such as component 14), component 18 uniquely combines male-oriented content with condition-specific descriptors, making it especially distinctive.
Limitations and Observations
- The texts are extremely heterogeneous and often lack useful information: some users write minimal descriptions, others provide personal stories or calls to action;
- Automatic topic extraction proved ineffective due to the semantic inconsistency of the content;
- The language used is exclusively Italian, with wide stylistic variation and frequent use of informal or non-standard language.
Suggestions for Future Developments
Some possible directions for improvement:
-
Introduce fine-tuning of LLMs on similar content to obtain more robust extractions (brand, category, condition);
-
The resale platform could leverage these insights to implement a system for automatic qualitative evaluation of texts, suggesting to users how to improve their descriptions (e.g., in terms of length, clarity, or key terms) to increase sales.