Objectives
The main purpose of this project was to uncover hidden patterns within the gathered data that could provide some insight on how the system operates behind the scenes.
After a phase of data gathering and cleaning, several models were tested to achieve reliable performance. The classifiers were evaluated based on their ability to correctly assign the “sold” label to an item. The post-processing dataset had roughly the same distribution of “sold” and “available” items, as the dummy classifier proves by scoring around 58% accuracy.
The first untuned models scored above 75% accuracy with 100% recall for the “sold” category, indicating a problem. It was discovered that some features initially considered “safe” were actually leaking information about the sale outcome. After addressing this issue, most models achieved an accuracy between 65% and 70%, but showed low recall for the “not sold” class (consistently around 55%, unless specifically trained to improve that metric, in which case values up to 70% were possible).
DTC and Random Forests
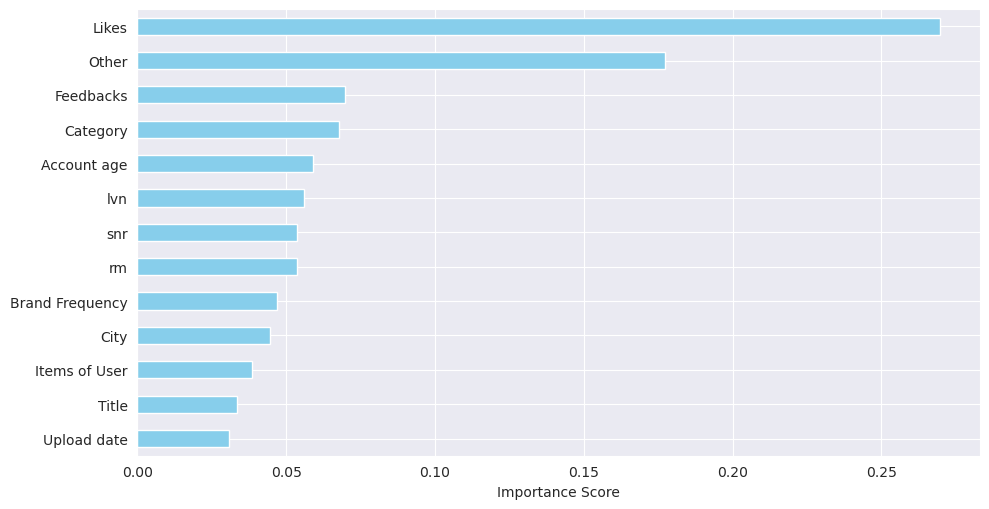
Decision Tree Classifiers (DTCs) and Random Forests performed slightly above 70% accuracy with minimal parameter tuning and emerged as the most effective models among those tested at this stage. These models also offered useful insights into feature importance. In the case of DTCs, the tree structure itself highlights the most influential features, while Random Forests aggregate importance across all trees—using, for example, mean decrease in impurity. Both approaches revealed that the number of likes an item receives is a key predictive factor, while other variables had a more limited impact.
Feature importance Random Forest
Unfortunately, neither Random Forest nor DTC handled categorical variables effectively, despite the applied encoding. This limitation resulted in relevant features and underlying patterns being ignored. To address this, alternative encoding strategies were tested, but had little effect on performance.
CatBoost
As a next step, CatBoost was introduced and it proved to be the best-performing model on this dataset: in the best training run, it achieved 78.3% accuracy, a 78.2% F1-score, and a ROC AUC of 0.876. The lowest metric was the recall for the “not sold” class, at 72%.
These results are likely due to CatBoost’s ability to natively process categorical features, which is particularly well-suited for this dataset. Fields such as city, region, brand, and size do not translate well into numerical values, and CatBoost’s internal handling preserves their structure and meaning.
Feature importance CatBoost
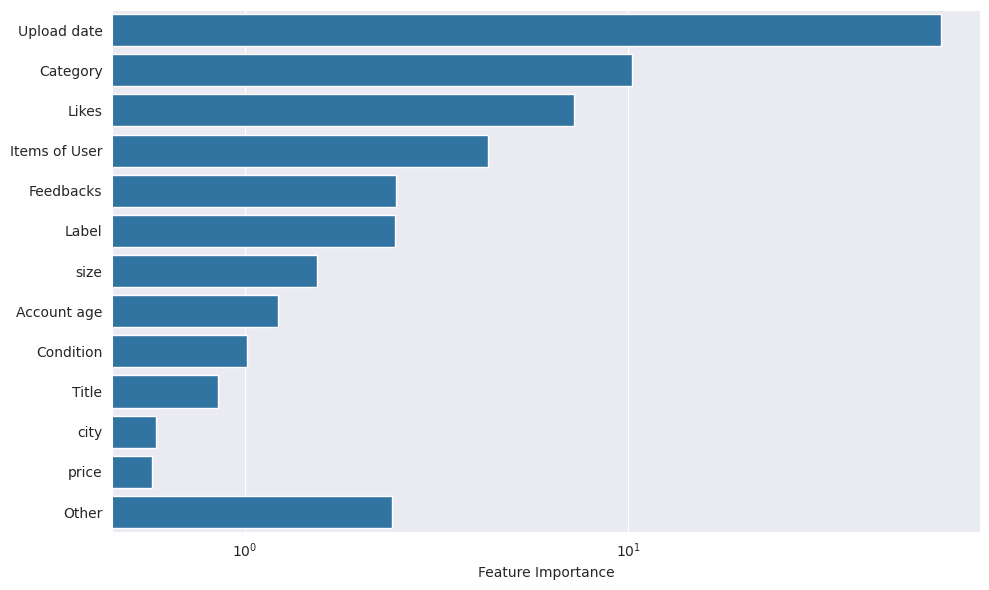
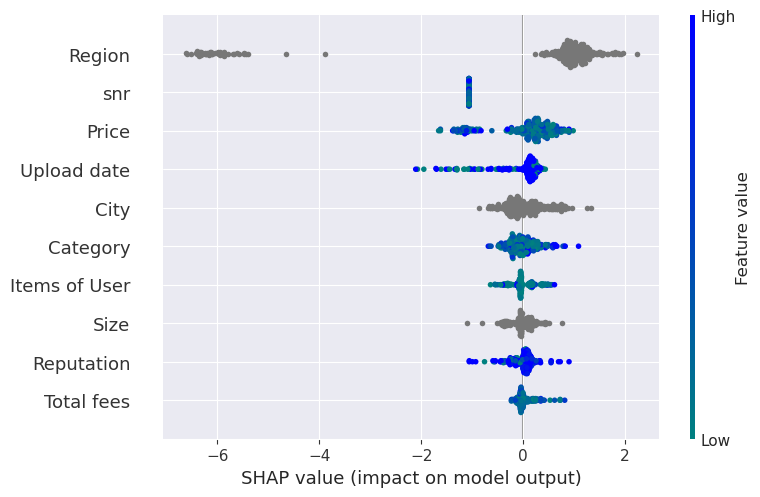
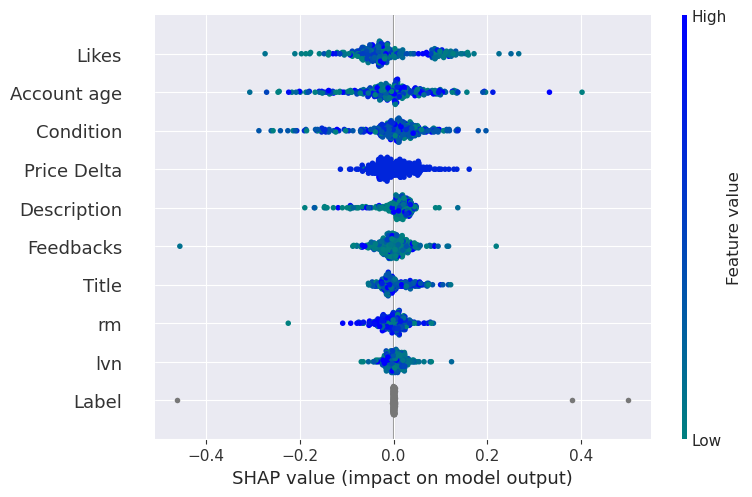
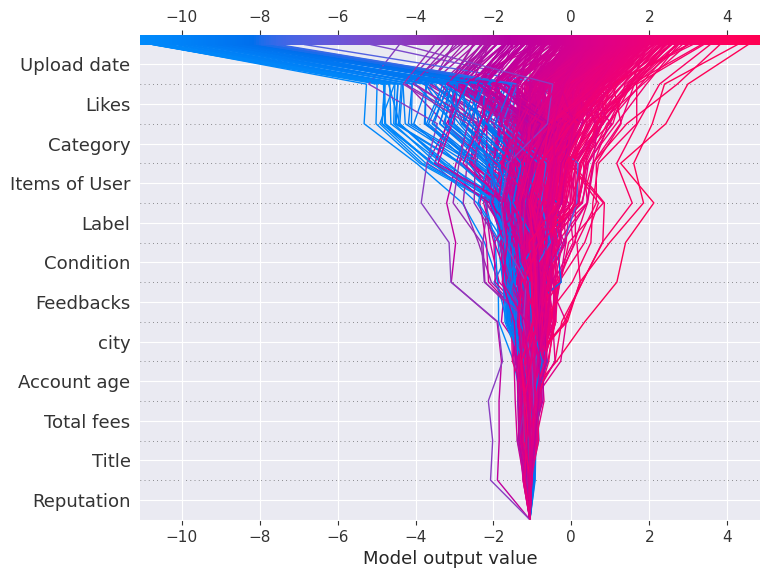
CatBoost also offers built-in tools for feature importance analysis, allowing for the generation of visual explanations. Results show that the most relevant numerical features are the publication date and the item category—supporting the idea that items from different categories follow different trends, and that the longer an item stays online, the more likely it is to be sold or removed. The number of likes also remains a strong predictor.
SHAP plots