The dataset contains structured information on items listed for sale, with attributes ranging from geographical coordinates (lat, long), pricing dynamics (initial_price, price_change, total_fees), interaction features (likes, reviews_count), to categorical descriptors (size_macro, item_condition, business flag).
- Removed label (brand): Due to high cardinality and sparsity, the label (brand) column was dropped to improve clustering quality.
- Clustering target isolation: The column sold was excluded from the clustering input to avoid target leakage. They were retained for post-hoc evaluation.
- Normalization: StandardScaler was applied for KMeans and Hierarchical clustering.
Hierarchical Clustering
A random sample of 100,000 samples was selected to compute the pairwise distance matrix. Three linkage methods were tested: single, complete, and ward.
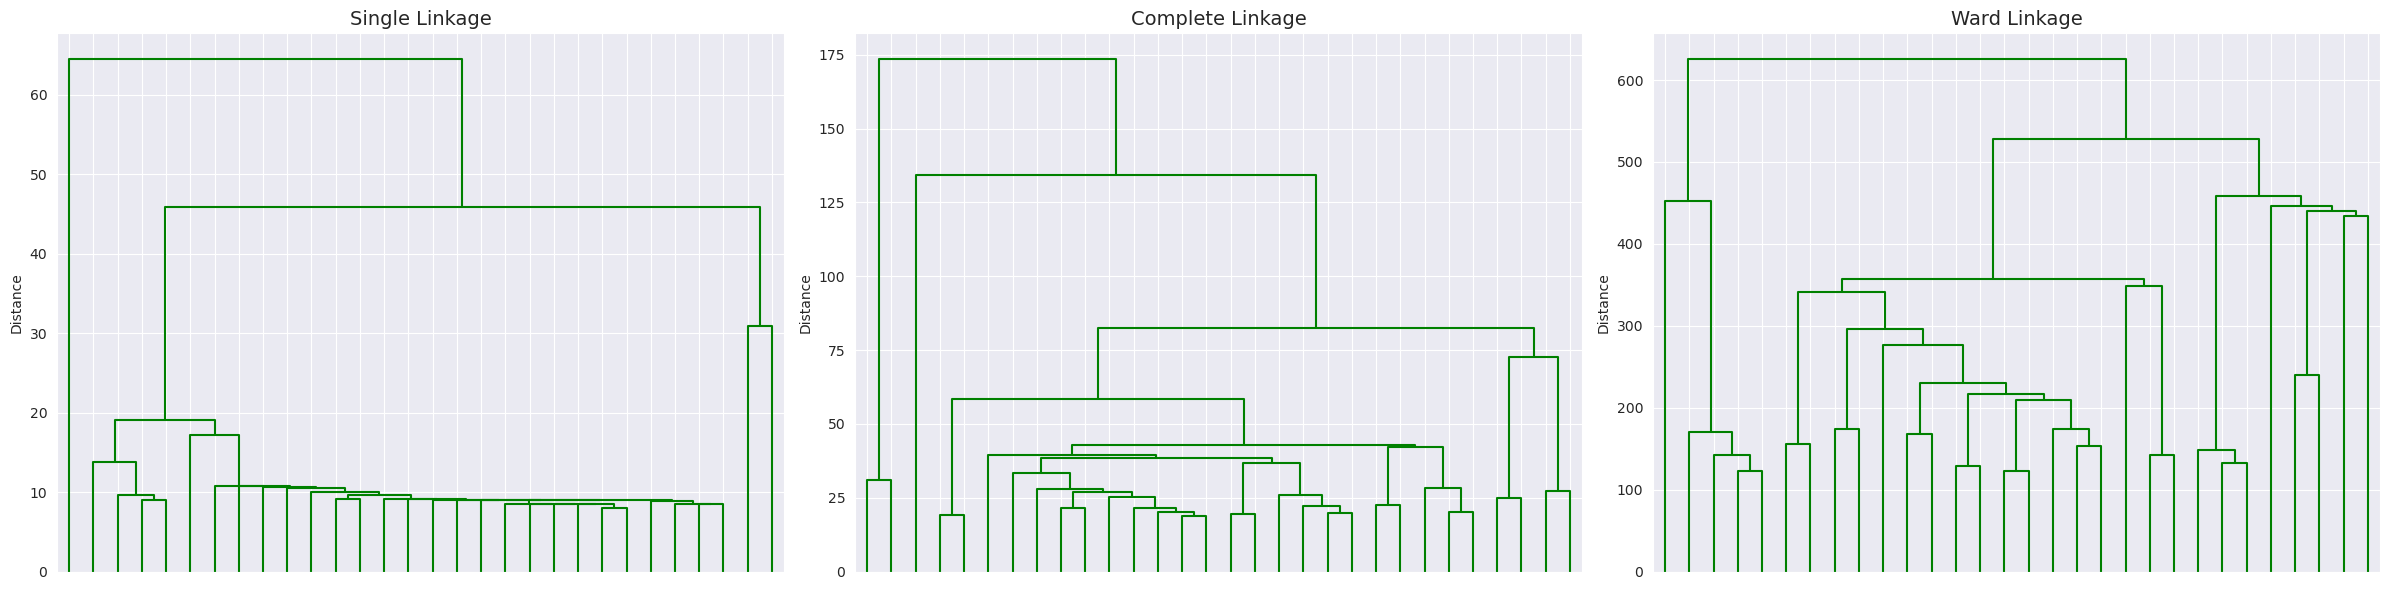
Ward linkage was selected for further analysis due to its superior structure and alignment with our interpretability goals.
Optimal Cluster Selection
To determine the ideal number of clusters, we tested multiple cut-off distances (t) on the Ward dendrogram and calculated the Davies-Bouldin (DB) score for each:
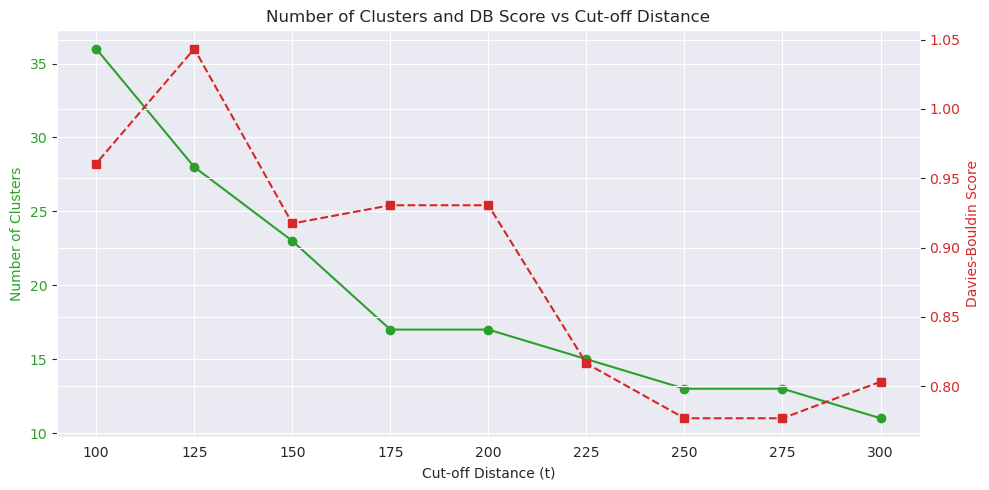
- The lowest DB score (~0.78) was observed at t = 250, which corresponds to 13 clusters.
- This value balances compactness (low intra-cluster variance) and separation.
Cluster Visualization using t-SNE
To validate the cluster structure in a 2D space, we performed t-SNE dimensionality reduction on the same sample used in hierarchical clustering:
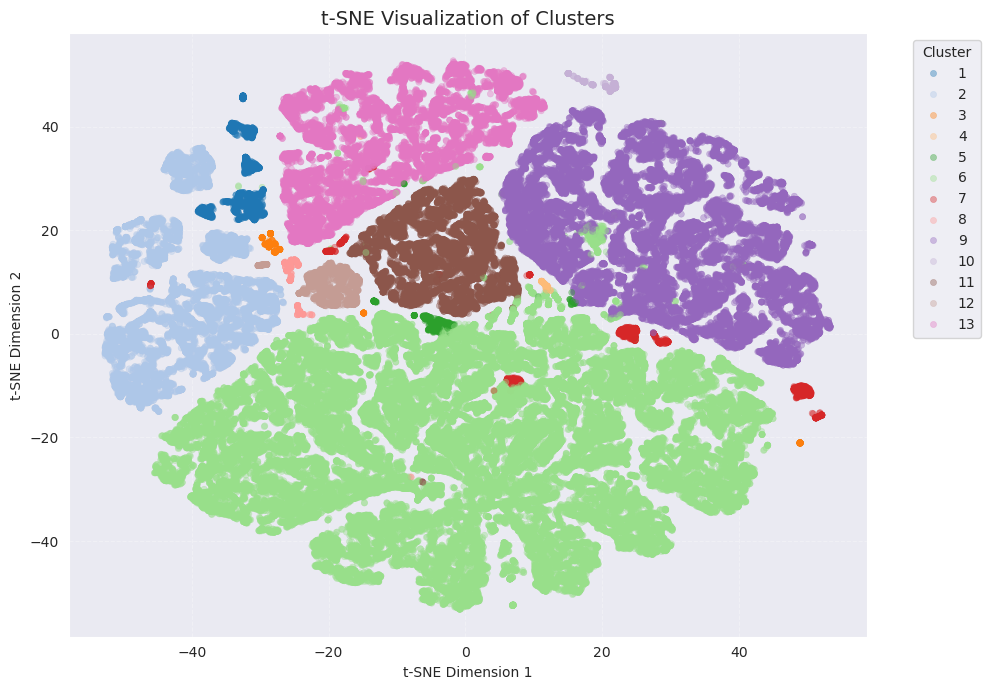
- Most clusters are visually distinct, confirming the effectiveness of Ward linkage.
- Minor overlaps suggest soft boundaries between some behavioral groups, which is expected in real-world data.
KMeans Clustering
The Davies-Bouldin Index combined to elbow method (based on inertia) was used to evaluate clustering compactness and separation. The index was computed for different values of K from 2 to 19. Lower values are better. We selected K = 10 as the optimal number of clusters for further analysis.
To visually assess the KMeans clustering, t-SNE was applied to a random sample (100,000 records) from the dataset and the 2D embedding was colored by cluster membership.
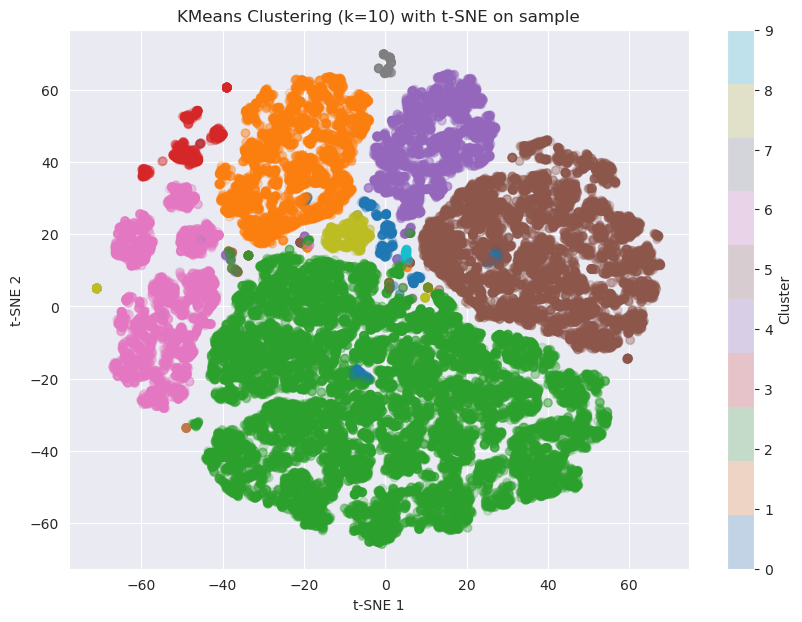
Clusters show good spatial separation in 2D. Minor overlaps exist, but structure is preserved.
This confirms that the 10 clusters learned by KMeans capture meaningful patterns in the data.
Method Comparison & Final Choice
| Clustering Method | Number of Clusters | Davies-Bouldin Index ↓ | Silhouette Score ↑ |
|---|---|---|---|
| KMeans | 10 | 0.832 | 0.4583 |
| Hierarchical (Ward) | 13 | 0.780 | 0.4089 |
- While Ward had a slightly better DBI, the Silhouette Score for KMeans was higher and it used fewer clusters (10 vs 13).
- Visual inspection via t-SNE showed better-defined and more compact clusters for KMeans.
- KMeans was therefore chosen for downstream analysis due to its interpretability, compactness, and better silhouette performance.
Cluster-Level Business Insight
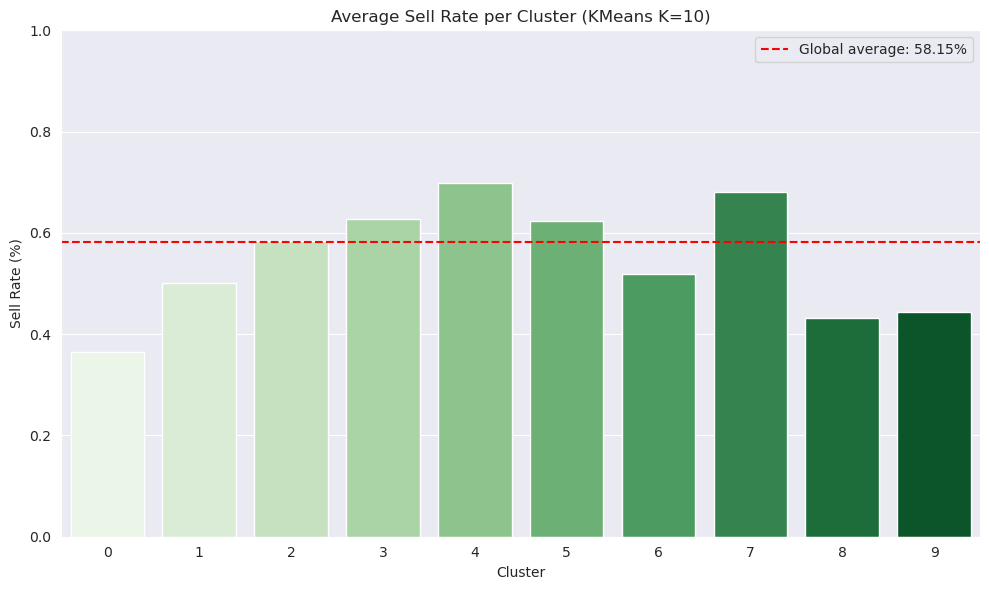
Each cluster’s average sold rate was compared to the global average (≈ 58.15%).
The following table summarizes each of the 10 KMeans clusters based on dominant item characteristics and behavioral traits:
| Cluster | Description |
|---|---|
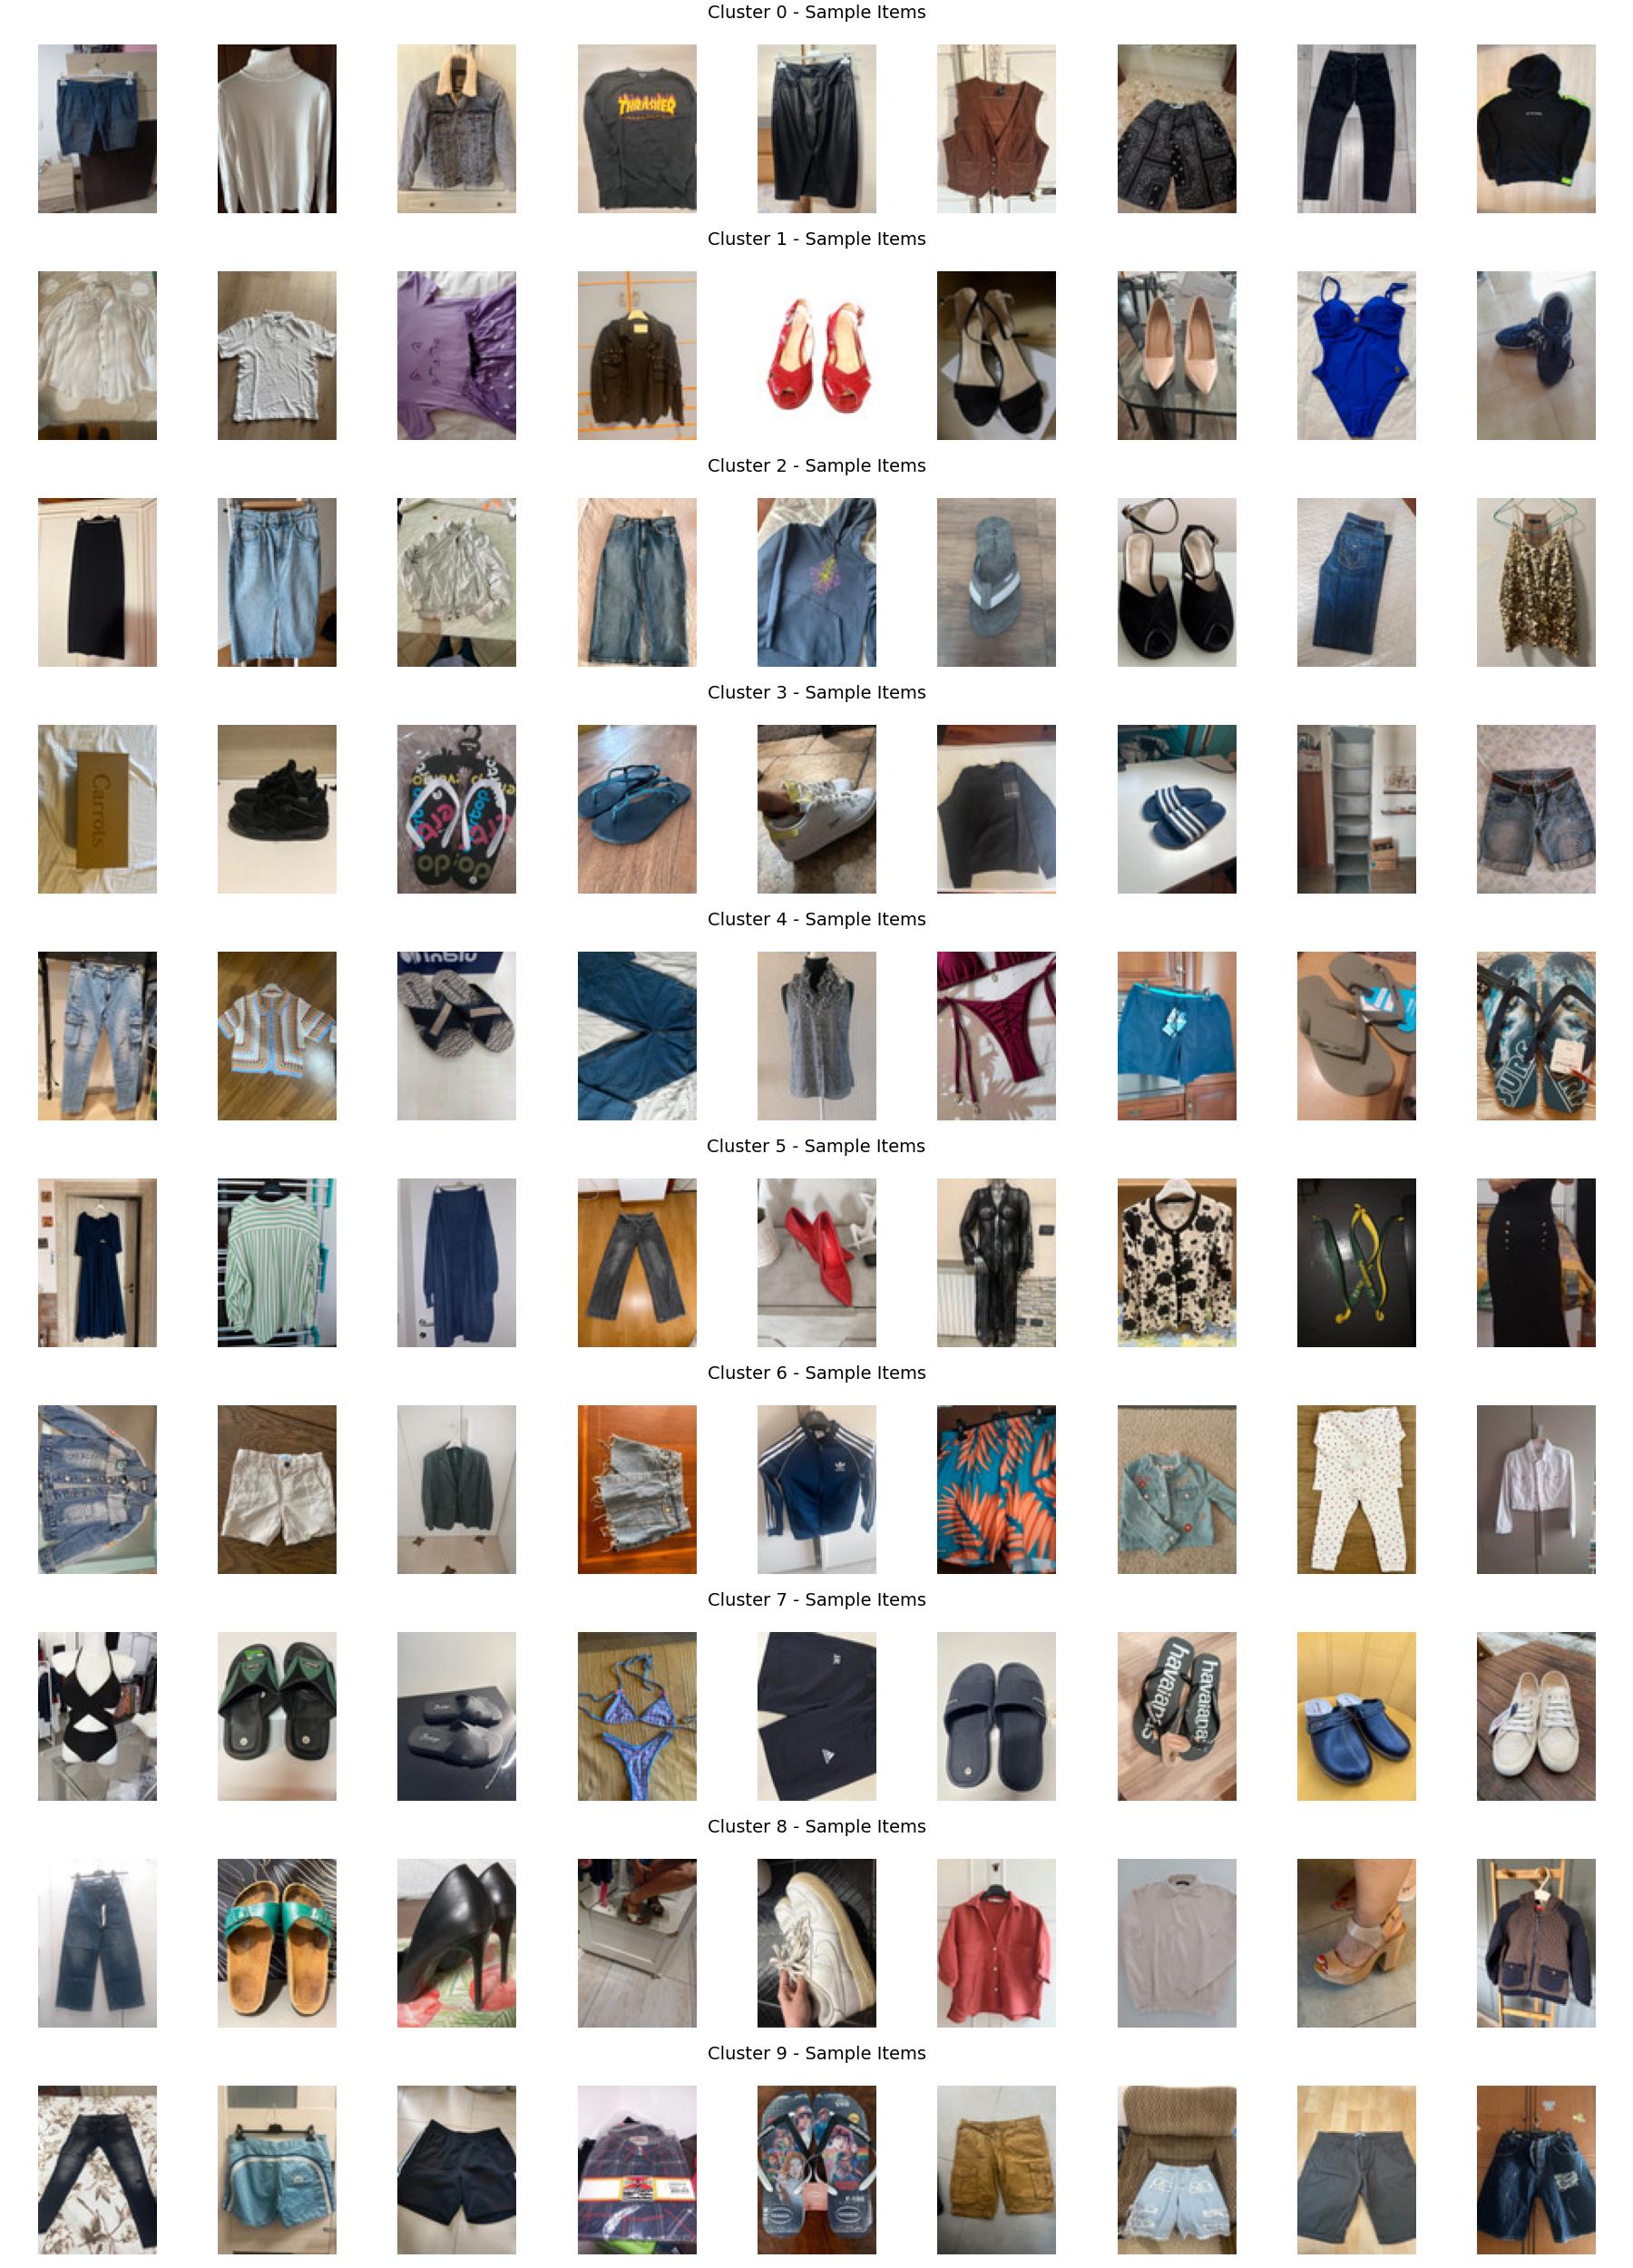
| 0 | This cluster mainly consists of items in "Very good" condition and is predominantly adult-sized. The items in this group are rarely sold. They are sold by users with fewer reviews and lower reputation. |
| 1 | This cluster mainly consists of items in "Good" condition and is predominantly adult-sized. The items in this group are frequently sold. |
| 2 | This cluster mainly consists of items in "Very good" condition and is predominantly adult-sized. The items in this group are frequently sold. |
| 3 | This cluster mainly consists of items in "Very good" condition and is predominantly unknown-sized. The items in this group are frequently sold. They tend to have a higher initial price. |
| 4 | This cluster mainly consists of items in "New with tags" condition and is predominantly adult-sized. Frequently sold. Higher initial price. |
| 5 | This cluster mainly consists of items in "New without tags" condition and is predominantly adult-sized. Frequently sold. |
| 6 | This cluster mainly consists of items in "Very good" condition and is predominantly child-sized. Frequently sold. Cheaper than average. |
| 7 | "New with tags", adult-sized. Frequently sold. Sold by users with more reviews. |
| 8 | "Satisfactory" condition, adult-sized. Rarely sold. Fewer likes than average. |
| 9 | "Very good" condition, adult-sized. Rarely sold. Higher initial price and fewer likes than average. |
Key findings:
- Clusters 4 and 7 show the highest conversion rates, approaching 70%.
- Cluster 0 performs significantly worse (≈ 37%), possibly pointing to poor listings or irrelevant products.
- These insights can guide business strategy, such as emulating successful cluster features for underperforming items.